
🧐 The One Skill That Makes You More Valuable Than Senior Analysts
As a data analyst, you are NOT paid to make dashboards. You are NOT paid to write SQL. You are NOT even paid to find insights.
You are paid to use data to improve the business.
That is it.
Too many analysts treat their charts like shiny trophies.
Look how complex this is. Look at all my filters. Look at my custom color palette. Look how hard I worked.
Your boss does not care.
They do not care about your process. They do not care about your code. They do not even care about the data.
They care about one thing. What do I need to do and how does it help the business?
If your chart does not answer that, you failed.
You are suffering from the Curse of Knowledge.
After spending hours, days, or weeks with a dataset, the conclusion is blindingly obvious to you.
So you forget what it is like to see it for the first time.
Your chart is never as obvious as you think it is, says Mike Cisneros, a Harvard trained data storyteller I had on my podcast.
Mike has worked with national security teams, led data viz projects, coached executives, and coauthored Storytelling with Data: Before & After (affiliate link).
He has seen which insights get ignored and which ones make things happen.
Here is his framework for breaking the curse
1. Get rid of what does not need to be there.
Once you know the single message you want to communicate, become a ruthless editor.
In Mike's words, getting rid of what does not need to be there, that is the critical thing. So that all that is left is just the meat on the bone.
Cut out all:
Gridlines
Borders
Unnecessary decimal points
Data series that do not support your main point
Time periods that are not relevant to the story
Clutter is the enemy of clarity.
2. Use more words than you think.
This might be the most important step. We like to think our charts are so good they speak for themselves. They do not.
As Mike says, the easiest and clearest way for people to understand the message you are trying to deliver is to say it in words.
Write a full sentence that states the main takeaway. It can be the title or a caption on the figure.
For example, Q3 sales increased by 20 percent after the new marketing campaign launched.
Let’s not make our audience guess. Tell them the conclusion up front in words and use the chart as the evidence.
3. Use color as a spotlight.
Color is not for decoration. It’s a tool to grab attention. Use it wisely.
Make most of your chart a neutral color, like gray. Then use one bright color to highlight the one thing you want your audience to see. The most important line, the most critical bar, the key outlier.
This guides their eyes exactly where you want them to go. Your job is not just to make charts. It is to make charts that are easily understood and drive action.
Once you start doing that, you become a data storyteller.
It is the fastest way to get noticed and become indispensable.
Want to see how it is done?
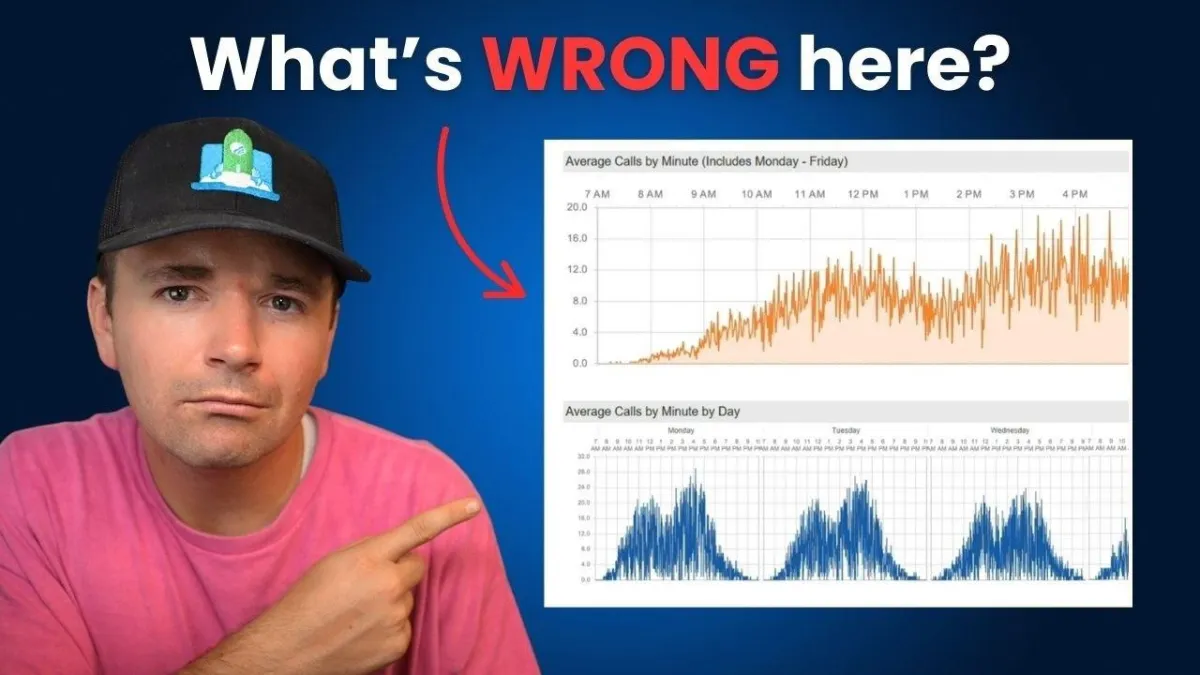
I had Mike do a live cleanup of a real world dashboard on the podcast.
You can watch him take a messy, confusing chart and turn it into something you will understand in five seconds flat.
It feels like watching a magician.