
📊 I used AI to build a data pipeline in 30 minutes!!
This issue is going to be a quick crash course on data engineering + AI. I know it’s a step beyond my usual beginner analyst stuff, but knowing this stuff will help you stand out. It’s what can make an okay data analyst into a great one. I hope it’s okay to share? Let’s do some basic data engineering definitions to get started:
👩💻 Data Analyst: person who analyzes data via descriptive analytics.
🧑🔧 Data Engineer: person who builds data infrastructure (moves data from A to B).
⭕ Data Pipeline: a conveyor belt for your data. It takes information from one place, it processes it, and sends it to another place so you can use it for things like reports or dashboards down the road.
🏭 ETL: Extract, transform and load. Specific type of data pipeline. Get data, do something with it, save it.
🗓️ Scheduling: Doing data engineering in an automated fashion. Set code to run at certain time.
🖨️ Data Operations Platform: software to manage data engineering tasks.
🦑 Keboola: Great data operation platform (also, the sponsor of today’s issue).
🤖 MCP: Model context protocol. Think of it as uploading your own data and own tools to an existing AI model like Claude or ChatGPT.
🦑🤖 Keboola MCP: Hooks up your data to Keboola and AI like Claude. Analyze your data, build databases, and create dashboards without writing much code.
If you’re confused, it’s okay—I was too. This is all pretty new to me to. And everyone actually. The Keboola MCP is one of the first of it’s kind, so don’t stress. But Keboola asked me to try it out and it was honestly pretty cool so I wanted to share. Here’s what I built and why I built it.
My old data pipeline sucked.
Some of you might remember the issue I wrote called “I Analyzed 2,893 Data Analyst Job Postings to Find Out What Skills You ACTUALLY Need to Get Hired”. I talked about how I found the MOST in-demand data tools by scraping my own data job board.
Spoiler alert: Excel, SQL, Tableau.
But that’s basically a data engineering project. Data has to go from my job board and dumped into a database. That table in the database needs to be cleaned up and stored properly. And then we can do analysis on that cleaned and stored data. That’s a data pipeline.
Well, I was basically doing all of that in Google Sheets which isn’t very reliable. This week, I was able to re-do the entire process but use Keboola’s new MCP to do it quickly and more reliable.
How was it faster? Well instead of me doing the formulas in Excel or writing any code, AI wrote the code for me.
How was it more reliable? Instead of using Google Sheets as a database, Keboola helped me use Google’s cloud SQL database (BigQuery). Plus, Google sheets doesn’t really have any data engineering scheduling (Keboola does though). So what did I actually build?
I built a data pipeline without coding.
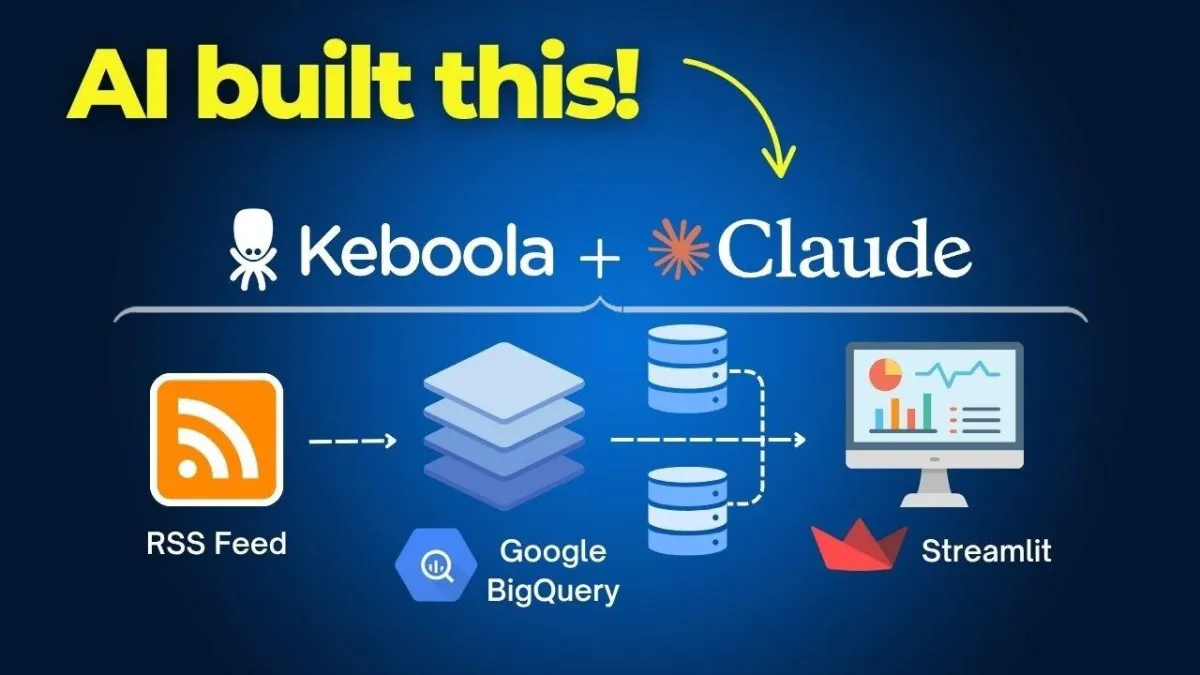
Truth be told, I’m a great data analyst. I’m a great data scientist. I’m just an okay data engineer. I don’t really enjoy data engineering. It’s not fun for me. And I’m not good at it. (Maybe those go together). But despite all of this, I was able to build a fully functioning data pipeline, only using Claude and Keboola. Here’s the diagram: 👇
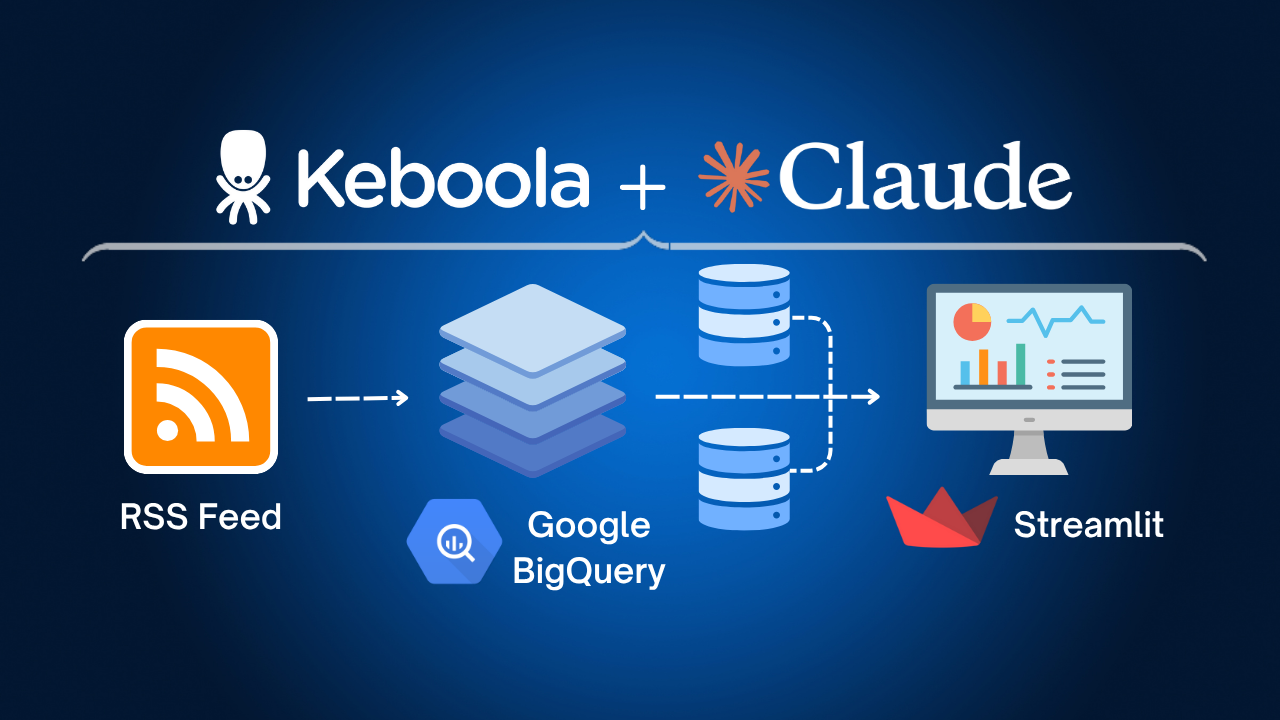
It gets my job listing data from the RSS feed (RSS stands for really simple syndication; it’s not a common data file type), saves it, cleans it up, does some aggregations, and then displays it in an interactive dashboard (via a tool called Streamlit).
Here’s what the prompts looked like to build the pipeline. Nothing crazy. 👇
Extracting data prompt:
Create a Custom Python component in Keboola that ONLY extracts the raw data from this exact RSS feed [insert RSS feed]. Please use the ID in the RSS feed as a primary key. Please don't do anything else.
Cleaning data prompt:
Please take the "title" column and split it into 3 new columns. One for the actual job title, one for the company, and one for the location. The title column ususually has all 3 seperated by a simple dash, but there can be extra dashes too so be careful. please keep it as simple as possible to start. we can always improve it later
Aggregation prompt:
Create a new transformation that aggregates the job postings by unique job titles. I'd like to see how many data analyst jobs there are for example. Please keep it simple to get started.
Data visualization prompt:
Can you take all the data we created and build a simple streamlit dashboard. please keep it simple for now!
Boom! Data pipeline built.
I definitely have faith that you can do something like this down the road. If you feel like this is too much, don’t stress. I just wanted to show you what can be done. It honestly took me a couple hours to build this. And I’m still working on finishing it. So no, I don’t think this means AI is going to replace yo
What does AI mean for me in the future?
To be 100% transparent, I don’t 100% know. I think anyone who is 100% sure is lying. But I know, I’m here to explore it and figure it out with you.
I really like this product, but if I asked my wife (who is a nurse) to create the data pipeline, she couldn’t do it. AI isn’t here to take your job. It’s here to help you do your job faster. It’s here to make you a better data professional. It’s here to help you reach the data world more easily.
And I’m going to try to help you use it the best way possible with in depth examples like this.
If you want to try this on you own, make a free Keboola account here.
Or you can follow my use case out (use this as your own job board RSS feed).
Thanks for reading. Please let me know if you have feedback or questions.