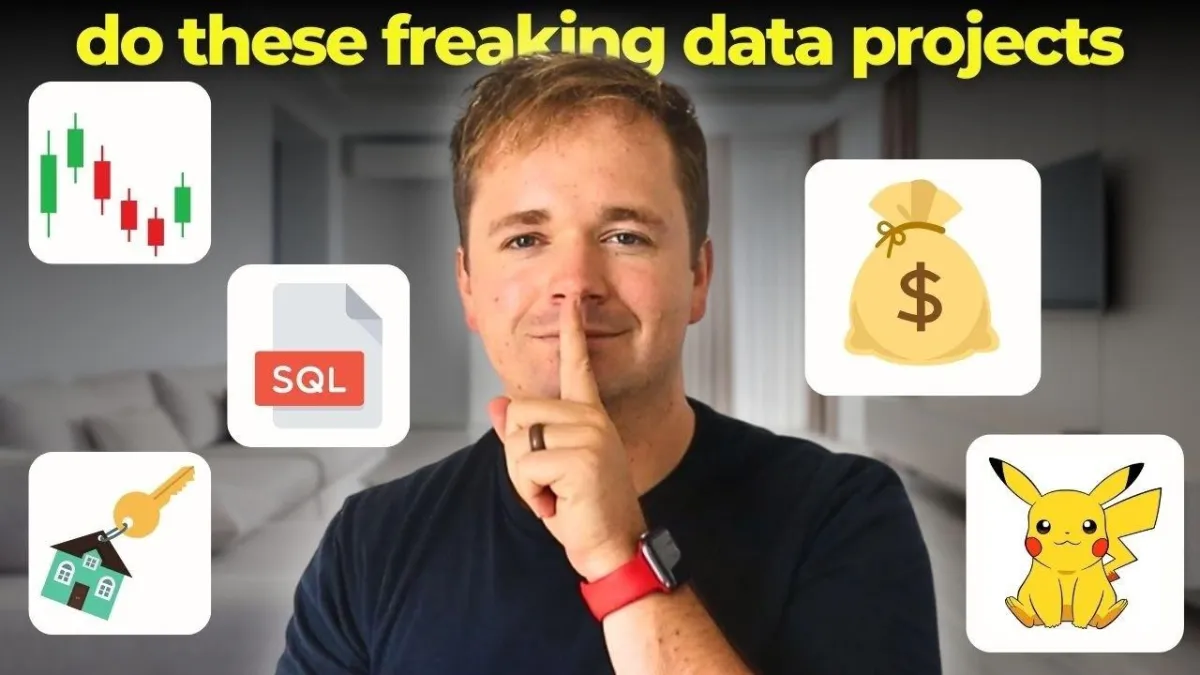
💻 5 Unique Data Analyst Projects (beginner to intermediate)
The data job market is crowded with people who all have the same basic skills. It’s a big reason you’re not getting hired.
So how do you differentiate yourself? Have a project portfolio.
Not sure where to start? Here are 5 clear project examples below. Try one that excites you.
1. Stock Price Analysis That Actually Makes Sense
Instead of picking a random company’s stock, choose one that you care about.
It could be Tesla because you like electric cars.
Or maybe Netflix because you love watching shows.
Download the daily stock data and start asking real questions.
How much does it move on an average day?
What was the biggest change, and what happened that day?
You can do this whole project in Excel.
That’s great because finance teams use Excel all the time.
This project is useful because there are so many financial analyst roles out there right now.
When you can take messy stock data and tell a clear story, people notice.
Want to make it more advanced?
Compare multiple stocks. Or you can use hourly data instead of daily.
The deeper you go, the more patterns you’ll find.
2. Real Estate Data That Hits Close to Home
Real estate is omnipresent. And prices are only going up. But by how much? And where at?
Everyone has opinions, but most of them are just guessing.
You can be the one who knows the facts.
Download public real estate data from your area and explore it.
Which neighborhoods are really the most expensive?
How much does an extra bedroom add to the price?
How much have prices gone up in the last 5 years?
This data is often messy…which is good.
That’s what real data looks like.
SQL could be a great tool for this.
You’ll practice grouping by city or neighborhood, finding averages, and listing highs and lows.
You can also add extra datasets like crime rates, school scores, or population details.
Now you’re not just looking at house prices, you’re seeing what affects them.
Fun & would look good on a portfolio
3. Your Own Money Story
Most people never look closely at their own spending.
It feels too personal. Too scary. Lowkey that’s kinda me.
That’s also why this kind of project stands out in a portfolio.
Download your bank and credit card history from the last year.
Many apps let you export it as a spreadsheet.
Then build a dashboard that shows where your money really goes.
Not where you think it goes, but where it actually goes.
You might be surprised.
Maybe coffee adds up faster than you expected.
Maybe your bills change with the seasons.
You might spot patterns you never saw before.
This project shows that you can turn boring data into insights that matter.
And in interviews, hiring managers love to see that you use data in your own life.
You don’t have to show exact income or account balances.
Just focus on the patterns and the insights.
4. Pokémon Data (Yes, Really)
It sounds fun, but Pokémon data is perfect for analysis.
There are lots of characters, stats, and types to explore.
It’s like a full dataset, ready to go.
You can ask:
Which Pokémon type has the strongest attack?
Are fire types stronger than grass types?
Do psychic types have better speed?
How do legendary Pokémon compare to others?
It gets even more fun when you look at Pokémon with two types.
How do those combinations affect stats?
Are there any hidden strengths?
This project stands out because it’s unexpected (and it’s friggin’ fun).
Hiring managers remember creative projects like this.
You won’t be “just another person who made a sales dashboard.”
Do this project in Python.
Use pandas for data work, and seaborn or matplotlib for the charts.
If you’re feeling ready, try some machine learning to group similar Pokémon (clustering).
Treat it like a real business analysis.
Ask smart questions, find clear answers, and explain them well.
5. Sports Data That Actually Matters
Pick a sport you follow and explore the data.
Not just because you love it, but because you understand it better than most people.
You could check:
Which NFL quarterbacks are most efficient per play?
Which NBA players score the most per minute?
Which soccer players create the best scoring chances?
Sports data is full of time-based stats and useful context.
You can explore how players change over time, or how teams perform across seasons.
Use any tool you like; Excel, SQL, Python, or Tableau.
What matters most is your thinking, not the tool.
Even if you don’t want a job in sports, this project proves you can find meaning in complex data.
And that’s useful in every industry.
Here's what makes these projects different:
They all connect to real life.
Stock analysis helps with investing. Real estate analysis helps with home buying. Personal finance helps with budgeting. Pokémon analysis shows creativity. Sports analysis connects with hobbies.
This type of stuff is what sets you apart. It’s what hiring managers remember. Remember, they’re human too. They like sports or have hobbies.
They don’t just remember your technical skills.
They remember your ability to find stories in data that matter.
Pick the one that excites you most. Spend this weekend getting started.
Not sure where to get the data? Read this.
Don’t worry about making it perfect. Worry about making it yours.
P.S. If you're excited to start one of these projects, I break them down in even more detail on the podcast.
And if you’re ready to build your portfolio for real, check out my bootcamp. We build 8 portfolio projects together, including a custom capstone project that’s uniquely yours.


